AI drone inspections · Solar · Wind · Mining

Intelligence from above. Decisions on the ground.

We fly autonomous drones over your solar farms, wind turbines and mine sites, then turn every frame into a prioritised, GPS-tagged action list — in days, not weeks, and with nobody working at height.

Thermal + RGB + LiDAR capture AI defect detection Based in Tirunelveli, serving India
Up to 70%lower inspection cost than manual and rope-access methods
20+wind turbines inspected per day, versus 1–2 manually
±2 cmelevation accuracy on mine and terrain surveys
500+ hasurveyed in hours instead of weeks
Solutions

Built for the assets that power India

Three industries, one promise: find problems earlier, fix them cheaper and keep your people out of harm's way.

Thermal drone image of solar panels showing hotspots01 · Solar

Solar farm intelligence

Every panel scanned, every hotspot located. Recover the energy your plant is quietly losing.

  • Automated thermal and visual panel inspections
  • Hotspot, cell and string defect detection, tagged to the exact panel
  • Vegetation encroachment maps that cut shading losses by up to 15%
  • Performance dashboards, site planning and construction progress tracking
25–30%lower inspection cost
40%faster defect identification
5–8%annual energy loss prevented
What you receive after a solar inspection

Illustrative samples of report pages
BLOCK C · THERMAL ANOMALY MAP Minor Hotspot / string Replace 12 flagged
Thermal anomaly mapThe whole plant on one map, with every defective panel highlighted, GPS-tagged and colour-coded by severity.Send crews straight to the faulty panel
+18.4 °C PANEL C-14-07 DefectTemperature riseSeverityAction Cell hotspot+18.4 °C vs stringReplace module
Panel-level defect databaseA record for each finding: thermal close-up, defect type, temperature rise, severity and the recommended fix.Evidence ready for warranty claims
ENERGY LOSS BY BLOCK 9%6%3%0 1.2%4.6%0.8%7.9%2.1%3.4% ABCDEF Cause in block D: string faults + vegetation shading
Performance loss analysisLost generation estimated block by block, with the cause identified, so you can see where repairs pay back fastest.Prevent 5–8% annual energy loss
VEGETATION ENCROACHMENT MAP 123 OvergrowthClearing zone9% of area affected
Vegetation encroachment mapOvergrowth and shading located across the plant, with clearing zones prioritised by the generation they cost you.Cut shading losses by up to 15%
CONSTRUCTION PROGRESS MAP Block ABlock BBlock C Block DBlock EBlock F 100%100%68%50%20%0% Overall completion56%
Construction progress reportRegular aerial surveys showing what is built in each block against the schedule: piling, structures, modules.Verify contractor progress without site visits
SITE PLANNING · TERRAIN & LAYOUT Panel rowsDrainage, excludedContours
Site planning & layout studyTerrain model, drainage paths and shading analysis turned into a panel layout that fits the land before you build.Avoid costly rework and flood-prone zones
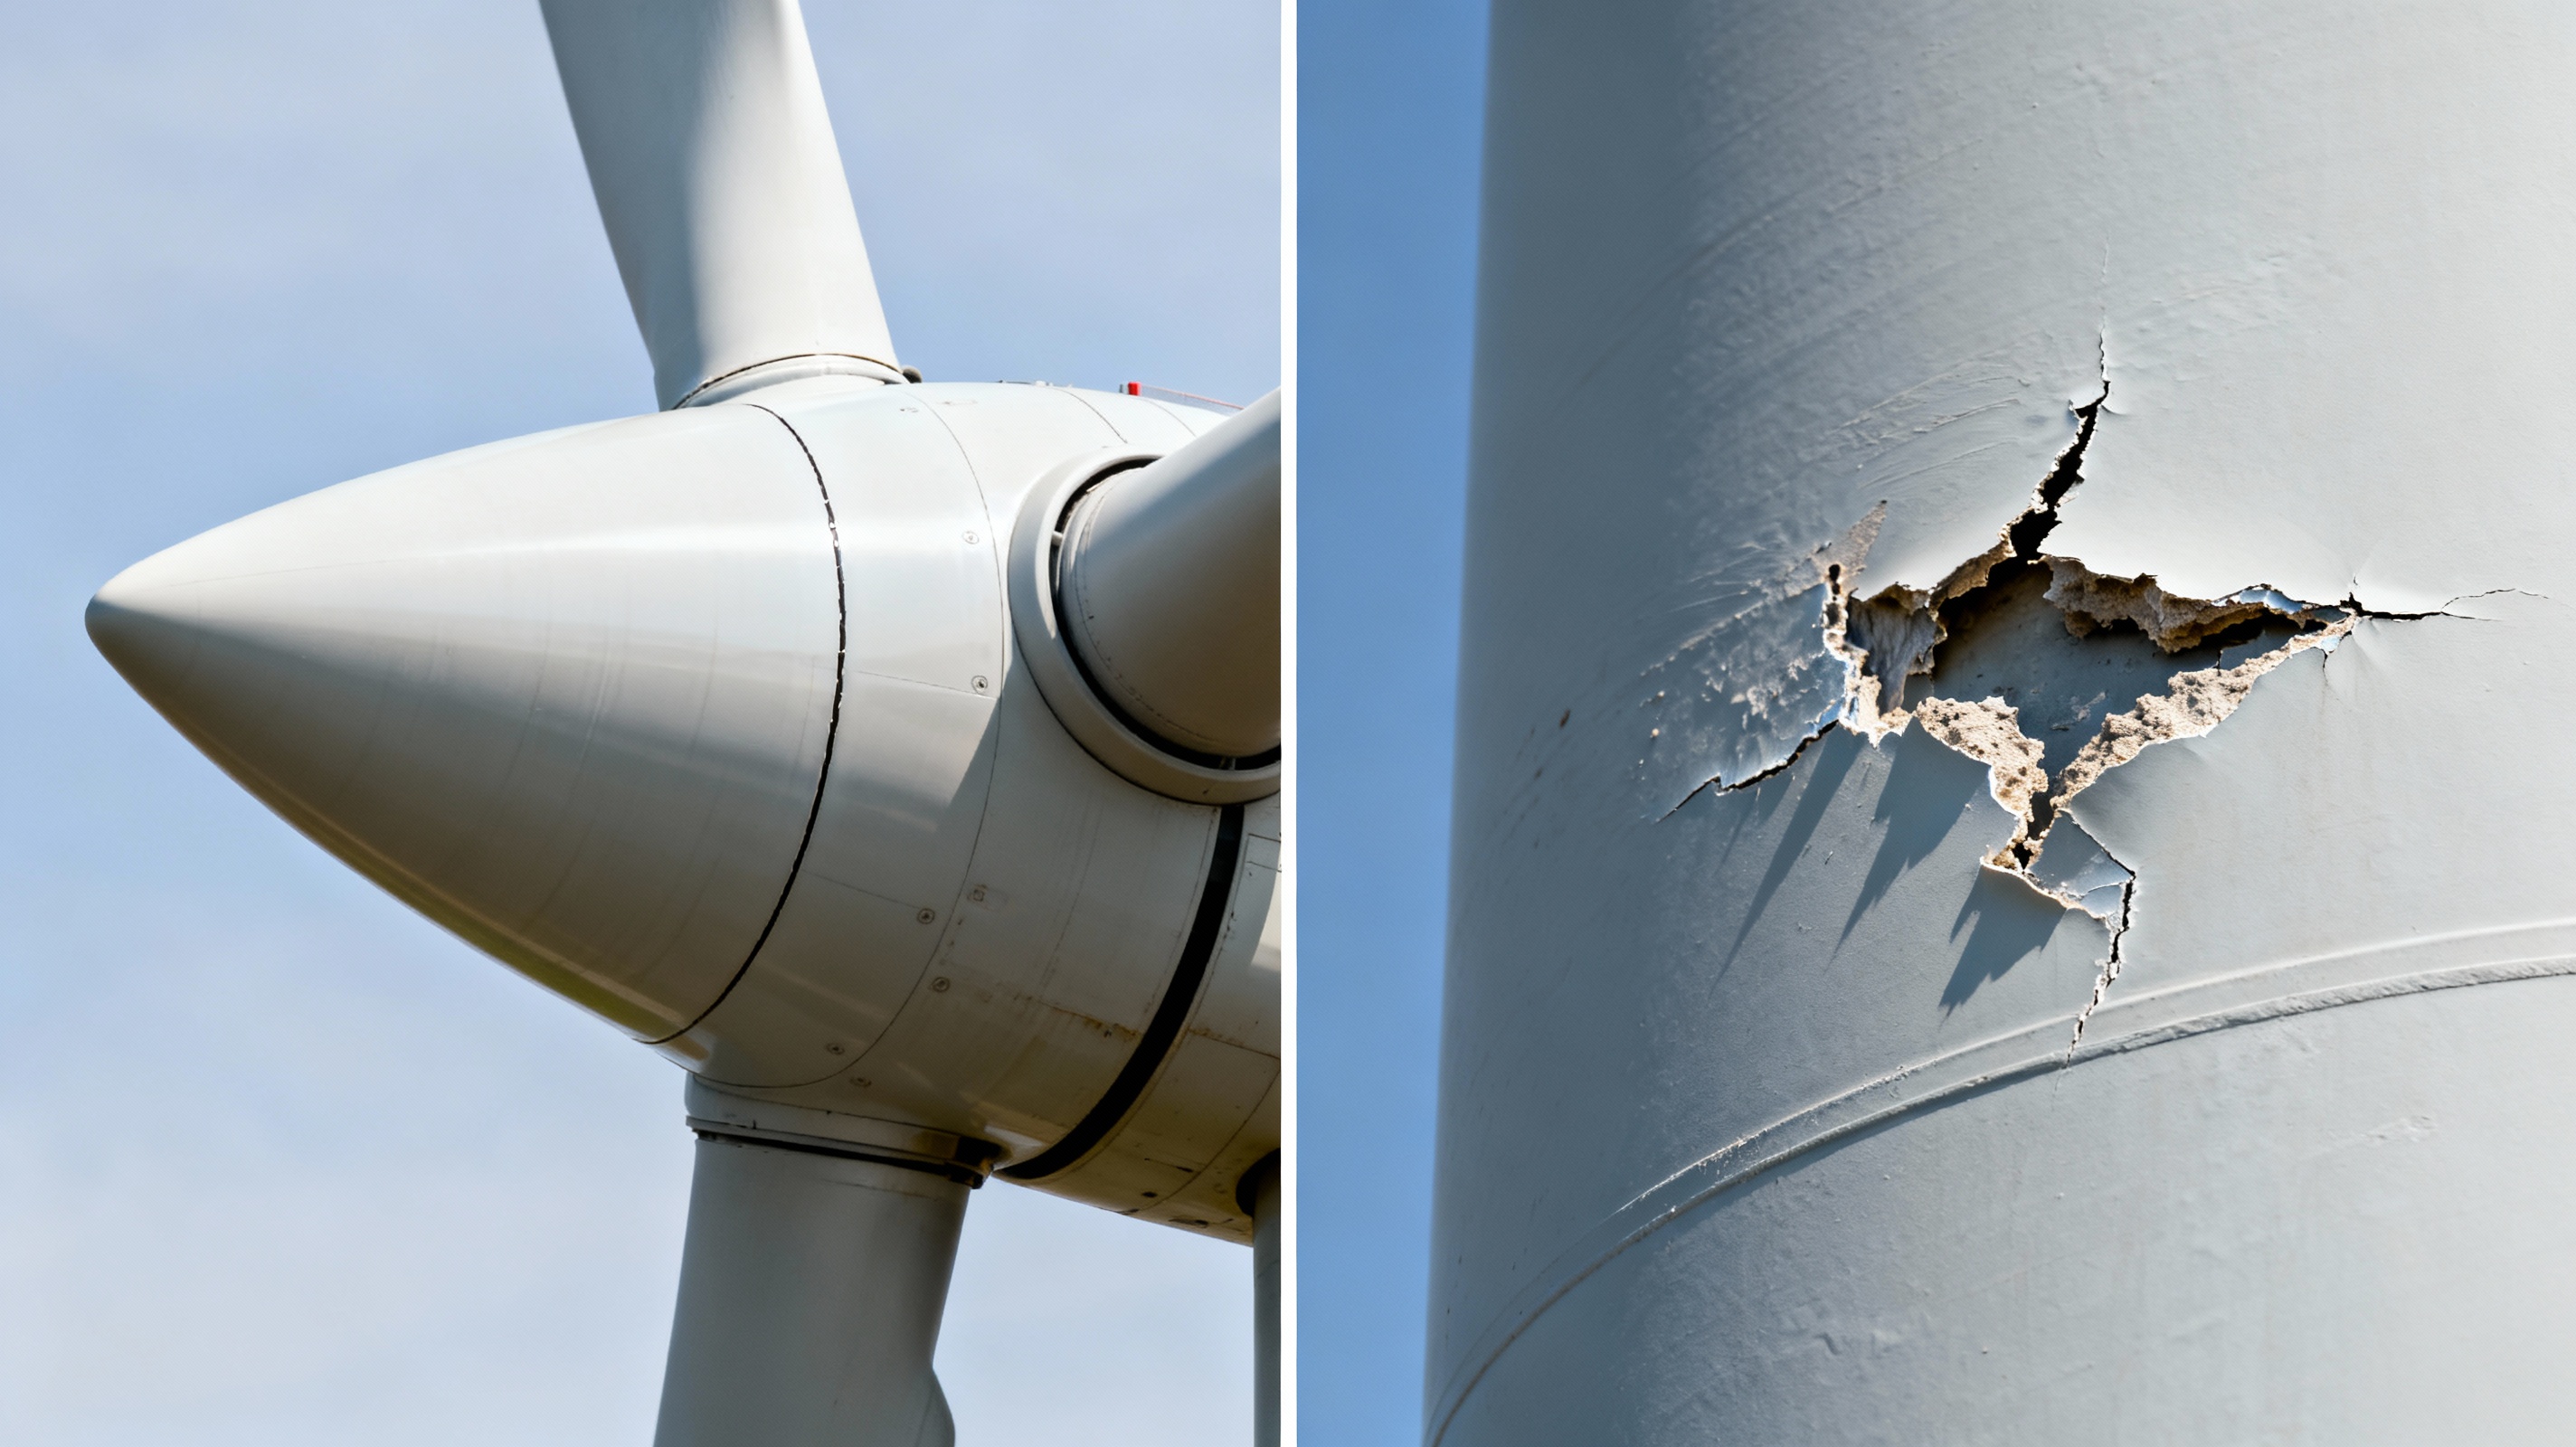
Close-up drone inspection of a wind turbine showing surface damage02 · Wind

Onshore & offshore wind monitoring

Close-range blade and tower inspection without rope crews, cranes or long shutdowns.

  • Blade surface reports: cracks, erosion and lightning strikes at millimetre precision
  • Tower exterior inspection: coating damage, corrosion and oil-leak staining
  • AI-driven predictive maintenance schedules that cut unplanned downtime by 35%
60–70%cheaper than rope access
50%less inspection downtime
15–20%longer blade life

What you receive after a wind inspection

Illustrative samples of report pages
Sample TURBINE T-07 · BLADE CONDITION MAP ABC RootTip Minor Monitor Repair now
Blade condition atlasEvery crack, erosion patch and lightning strike pinned to its exact position on each blade and ranked by severity.Know which blade to repair first
Sample CRACK · 97% 42 mm DEFECT #118 TypeLocationSeverityAction Leading-edge crackBlade B · 31.400 mRepair ≤ 30 days
Defect records with measurementsHigh-resolution close-ups with AI detection, size, location along the blade and a recommended action for each finding.Brief repair crews without a second climb
Sample PREDICTIVE MAINTENANCE SCHEDULE M1M2M3M4M5M6 T-03T-07T-12T-19T-24 Today UrgentPlannedRoutine
Predictive maintenance planAn AI-prioritised repair timeline across the whole farm, so work is grouped into planned windows instead of emergency call-outs.Up to 35% less unplanned downtime
TOWER EXTERIOR INSPECTION Coating & paintSurface corrosionOil-leak stainingVisible foundation Chipped area · touch upNone detectedNone detectedHairline crack · monitor
Tower exterior inspectionClose-up imagery of the tower surface from base to nacelle: coating damage, corrosion, oil-leak staining and visible cracks at the foundation.Catch surface damage before it spreads
LIGHTNING STRIKE INVENTORY T-02 · tip receptorT-08 · surface burn Repair urgentMonitor4 strikes mapped
Lightning strike inventoryEvery strike location across the farm mapped, photographed and ranked by repair urgency.Support insurance and warranty claims
FLEET HEALTH OVERVIEW 0102030405060708091011121314151617181920 HealthyMonitorRepair 1442 20 turbines inspected · 60 blades · one consolidated view
Fleet health dashboardThe condition of every turbine on one screen, so asset managers can compare sites and budget repairs.Inspect 20+ turbines a day, see all at a glance
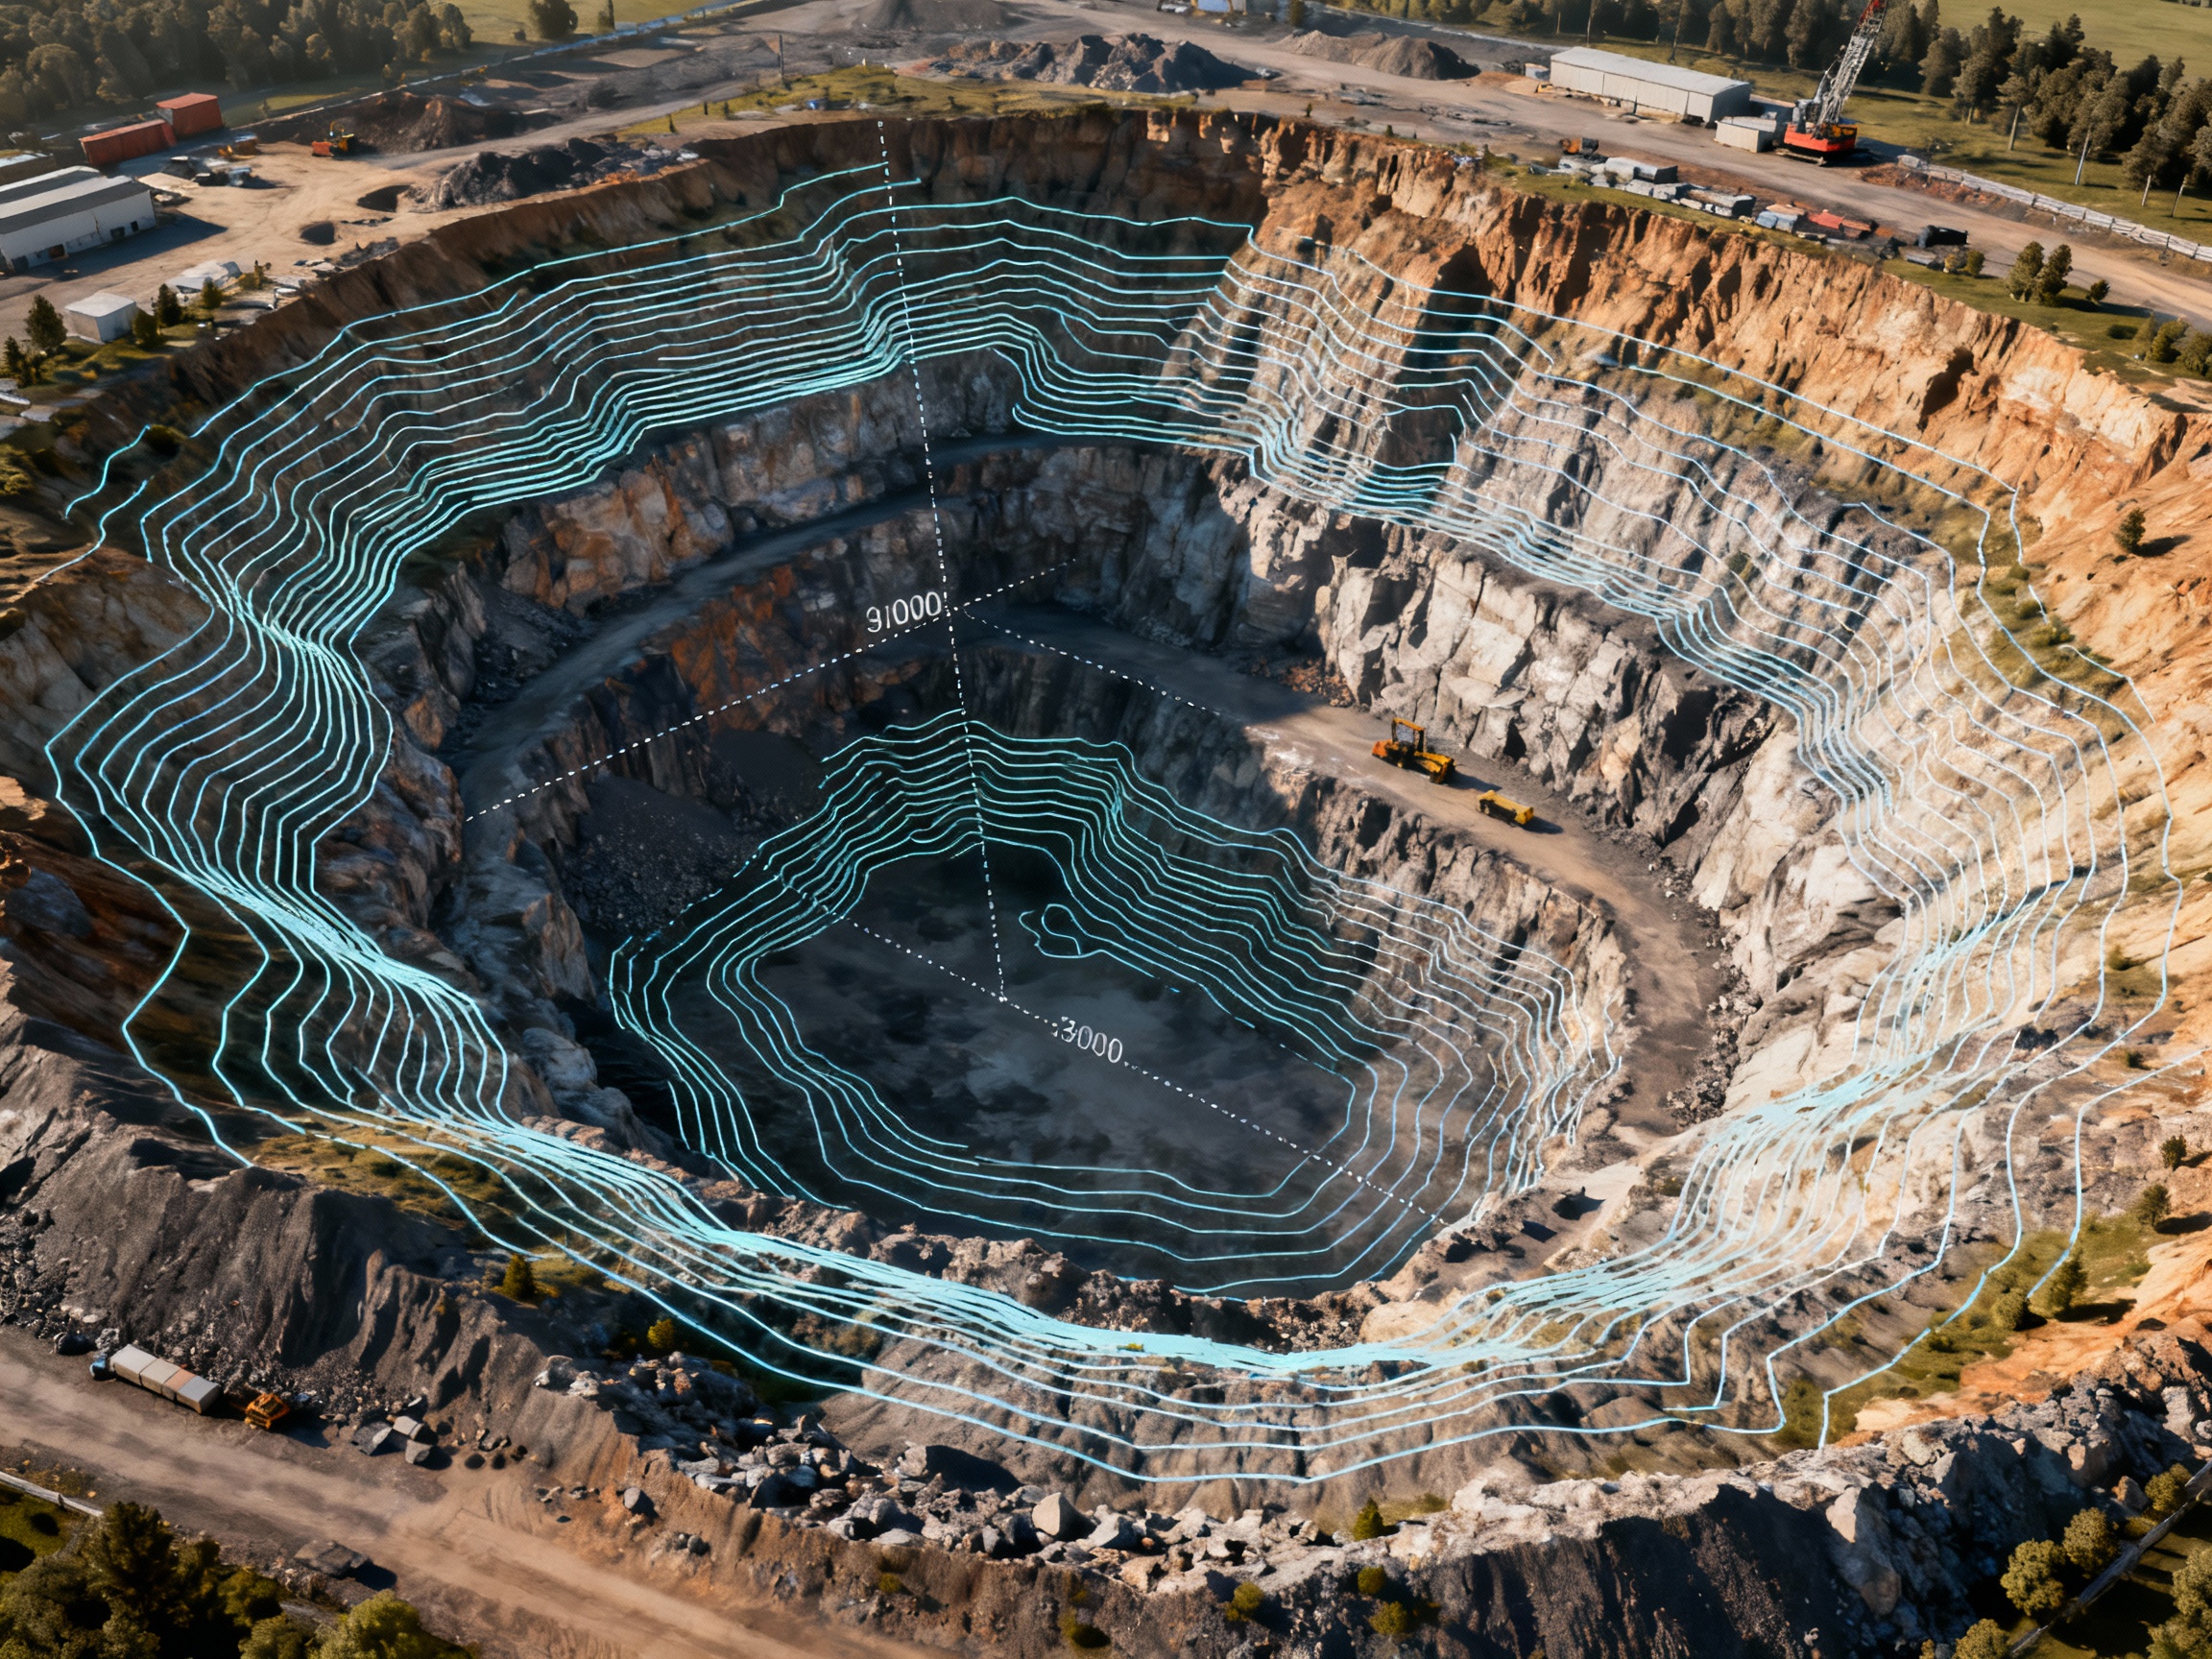
Aerial view of an open-pit mine with contour mapping overlay03 · Mining

Mining operations intelligence

Survey-grade volumes and terrain models, captured from the air while the pit keeps working.

  • Stockpile volumes accurate to ±1–2%, versus ±10–15% for manual surveys
  • High-resolution orthomosaics for planning, progress and compliance
  • AI hazard detection: slope instability, water accumulation, unauthorised access
  • Haul road condition and environmental monitoring
80%faster surveys
90%less surveyor exposure to hazards
±2 cmelevation accuracy

What you receive after a mine survey

Illustrative samples of report pages
Sample STOCKPILE VOLUME REPORT SP-01SP-02SP-03 48,200 m³91,750 m³22,400 m³ Accuracy ±1.5%
Stockpile volume inventoryEvery pile measured from a 3D surface model, with volume and change since the last survey, ready for reconciliation.±1–2% versus ±10–15% manual estimates
Sample DIGITAL ELEVATION MODEL · PIT 2 Haul ramp +96 m+12 m
Orthomosaic & elevation modelA measurable, up-to-date map of the whole site with contours, bench heights and cut/fill against your mine plan.Track excavation vs plan every month
Sample SAFETY HAZARD MAP 123 Slopeinstability Water Haul road
Safety & compliance mapAI-flagged slope instability, water accumulation and unauthorised access, plus haul roads graded by maintenance priority.Hazards found with no one in the active zone
PROGRESS VS PLAN · SECTION A–A′ RemainingOver-cut Mine planSurveyed surface Remaining to planBench compliance 124,000 m³94%
Progress vs plan reportSurveyed surface compared with your mine design: volumes moved, volumes remaining and any over-cut benches.Settle contractor quantities with evidence
HAUL ROAD CONDITION · 15 KM Surface roughness 051015 km RuttingDrainage GoodMaintain soonRepair now 10.9 km2.6 km1.5 km
Haul road condition reportThe full road network graded by chainage for rutting, drainage and gradient, with a maintenance priority list.Less tyre wear and fewer truck delays
ENVIRONMENTAL MONITORING MAP ! Lease Vegetation Rehab Water Boundaryalert
Environmental monitoring mapLease boundaries, vegetation, water bodies and rehabilitation progress tracked from survey to survey.Audit-ready evidence for regulators
How it works

From first call to final report in four steps

Scope

We review your site, assets and goals, then design the flight plan and deliverables around them.

Fly

Autonomous missions capture thermal, visual and LiDAR data on repeatable flight paths.

Analyse

Computer-vision models detect, classify and rank every anomaly; our specialists verify the results.

Act

You receive GPS-tagged reports, maps and a prioritised maintenance plan your team can execute immediately.

Technology

The stack behind every flight

Aerial hardware is only half the job. The value is in what the data tells you.

Autonomous drone operations

Pre-programmed, repeatable flight paths for consistent data capture, visit after visit.

AI video analytics

Real-time object detection and anomaly identification straight from the video feed.

Computer vision

Advanced image processing that recognises defects the human eye misses.

Predictive analytics

Machine-learning forecasts that tell you what to repair before it fails.

3D mapping & digital twins

High-resolution orthomosaics, elevation models and digital twins of your site.

Real-time reporting

Clear, audit-ready reports and dashboards your operations team can act on at once.

Full asset lifecycle

One partner from planning to maintenance

Pre-construction Plan

  • Site surveys and terrain analysis
  • Environmental assessments
  • Layout and planning optimisation

Construction Build

  • Progress monitoring against plan
  • Quality assurance inspections
  • Documentation and reporting

Operations Run

  • Scheduled inspections and defect detection
  • Performance analytics
  • Predictive maintenance
Projects

Results, measured against the old way

What aerial intelligence delivered compared with conventional inspection and survey methods.

Solar energy

Large-scale solar farm inspection

Automated thermal inspection of a 500+ acre solar installation in Rajasthan.

3 daysto inspect6 weeks manual
72%lower cost₹18L vs ₹65L
2,847defective panels found
Deliverables & impact
  • Thermal anomaly maps with every panel GPS-tagged and categorised
  • Performance loss analysis: projected annual revenue recovery of ₹1.2 Cr
  • Vegetation overgrowth report: 12% of area affected, remediation prioritised
  • 98% detection accuracy versus 60–70% for visual inspection
  • Prevented a 5.8% annual energy loss, with zero work at height
Wind energy

Offshore wind farm monitoring

Blade and tower exterior inspection of a 50-turbine offshore wind farm.

5 daysto inspect25–30 days rope access
75%lower cost₹45L vs ₹1.8 Cr
342defects across 150 blades
Deliverables & impact
  • Blade surface condition atlas with millimetre-level crack detection
  • Tower exterior survey: coating damage and corrosion mapped
  • AI-prioritised repair timeline, reducing downtime by 35%
  • Lightning strike inventory: 23 locations mapped by repair urgency
  • 40% fewer unplanned outages, with zero offshore rope work
Mining

Open-pit mine survey

Volumetric analysis and safety compliance monitoring of a 1,000+ acre limestone mine.

2 daysto survey4–6 weeks traditional
86%lower cost₹12L vs ₹85L
±1.5%volume accuracy on 2.3M m³
Deliverables & impact
  • Inventory of 47 stockpiles
  • Monthly orthomosaics tracking excavation against plan
  • 18 slope-instability zones and 7 water-accumulation areas flagged
  • 15 km haul road network graded by maintenance priority
  • ±2 cm accuracy with zero surveyor exposure to active zones
Multi-industry

Renewable energy hub planning

Pre-construction site analysis for a 300-acre hybrid solar–wind facility.

2 weeksto deliver6–8 weeks typical
77%lower cost₹8L vs ₹35L
12%more efficient panel layout
Deliverables & impact
  • LiDAR terrain model at sub-5 cm accuracy, 200 points/m²
  • Hydrological analysis: drainage patterns and flood-risk zones
  • Vegetation mapping and obstacle identification
  • Shading-aware solar layout and terrain-integrated turbine placement study
  • ₹45L saved in future drainage costs
About us

Where artificial intelligence meets aerial excellence

Kyriose Eiden Aerial Solutions combines autonomous drones with advanced AI video analytics to serve the solar, wind energy and mining industries. Our mission is simple: improve operational efficiency, maximise safety, reduce cost and drive sustainability through real-time aerial intelligence and predictive insight.

Headquartered in Tirunelveli, Tamil NaduAt the heart of India's renewable energy corridor, with direct access to major solar and wind installations.

Safety first

We remove people from dangerous inspections entirely.

Innovation

Purpose-built AI and drone workflows, not generic tools.

Sustainability

Supporting renewable energy and responsible mining.

Expert team

Specialists in AI, robotics and the industries we serve.

FAQ

Questions we hear most

Which industries do you work with?

Solar farms, onshore and offshore wind farms, and mining operations. We support each across the full asset lifecycle: pre-construction surveys, construction monitoring, and ongoing operations and maintenance.

How is a drone inspection better than a manual one?

It is faster, safer and more precise. A drone can inspect 20+ turbines a day against 1–2 manually, survey 500+ hectares in hours rather than weeks, and it does so without anyone working at height or entering an active zone. AI analysis then catches defects that visual checks routinely miss.

What do I receive at the end?

Clear, actionable deliverables: thermal anomaly maps, blade condition reports, stockpile volume inventories, orthomosaics, 3D terrain models and a prioritised maintenance plan — every finding GPS-tagged and ranked by urgency.

Where do you operate?

We are headquartered in Tirunelveli, Tamil Nadu, in India's renewable energy corridor, and take on projects across India.

How do we get started?

Send us your site location, asset type and approximate size using the form below, or call us. We will come back with a scope, timeline and quote.

Get in touch

Ready to see your site from above?

Tell us about your assets and we will propose an inspection plan with a clear scope, timeline and cost.

Call+91 83005 06005 WhatsAppChat with us Emailinfo@kyriose.in
OfficeTirunelveli Main, Reddiarpatti, TN 627007, India

Opens your email app with the enquiry ready to send.

Call Get a quote